Coronavirus 26
All the talk is of lifting the lockdown, when, how....?
We need to understand how pandemics spread and where the uncertainties lie.
For instance, what difference does varying the R make?
Pluck some input number out of the air: say number of infections is 250000 and infection-fatality rate is 1%
R ~Total deaths
>1 Half a million soon
1 Half a million eventually
0.9 22500
0.8 10000
0.7 5800
0.6 3750
0.5 2500
0.4 1670
0.3 1070
0.2 625
0.1 280
That, of course, is stupidly simple, but perhaps gives an inkling of what is meant when it is said the R needs to be below 1 and that 0.5 is much better than 0.9
Marcel Salathé & Nicky Case have produced an excellent tool to understand the thing properly.
Simple yet sophisticated. Simplicity, like minimalism, takes sophistication.
Please, please, devote the time necessary to go through it and then share it with everybody else. Understanding such things should be the duty of every citizen capable of understanding such things.
What Happens Next?COVID-19 Futures, Explained With Playable Simulations
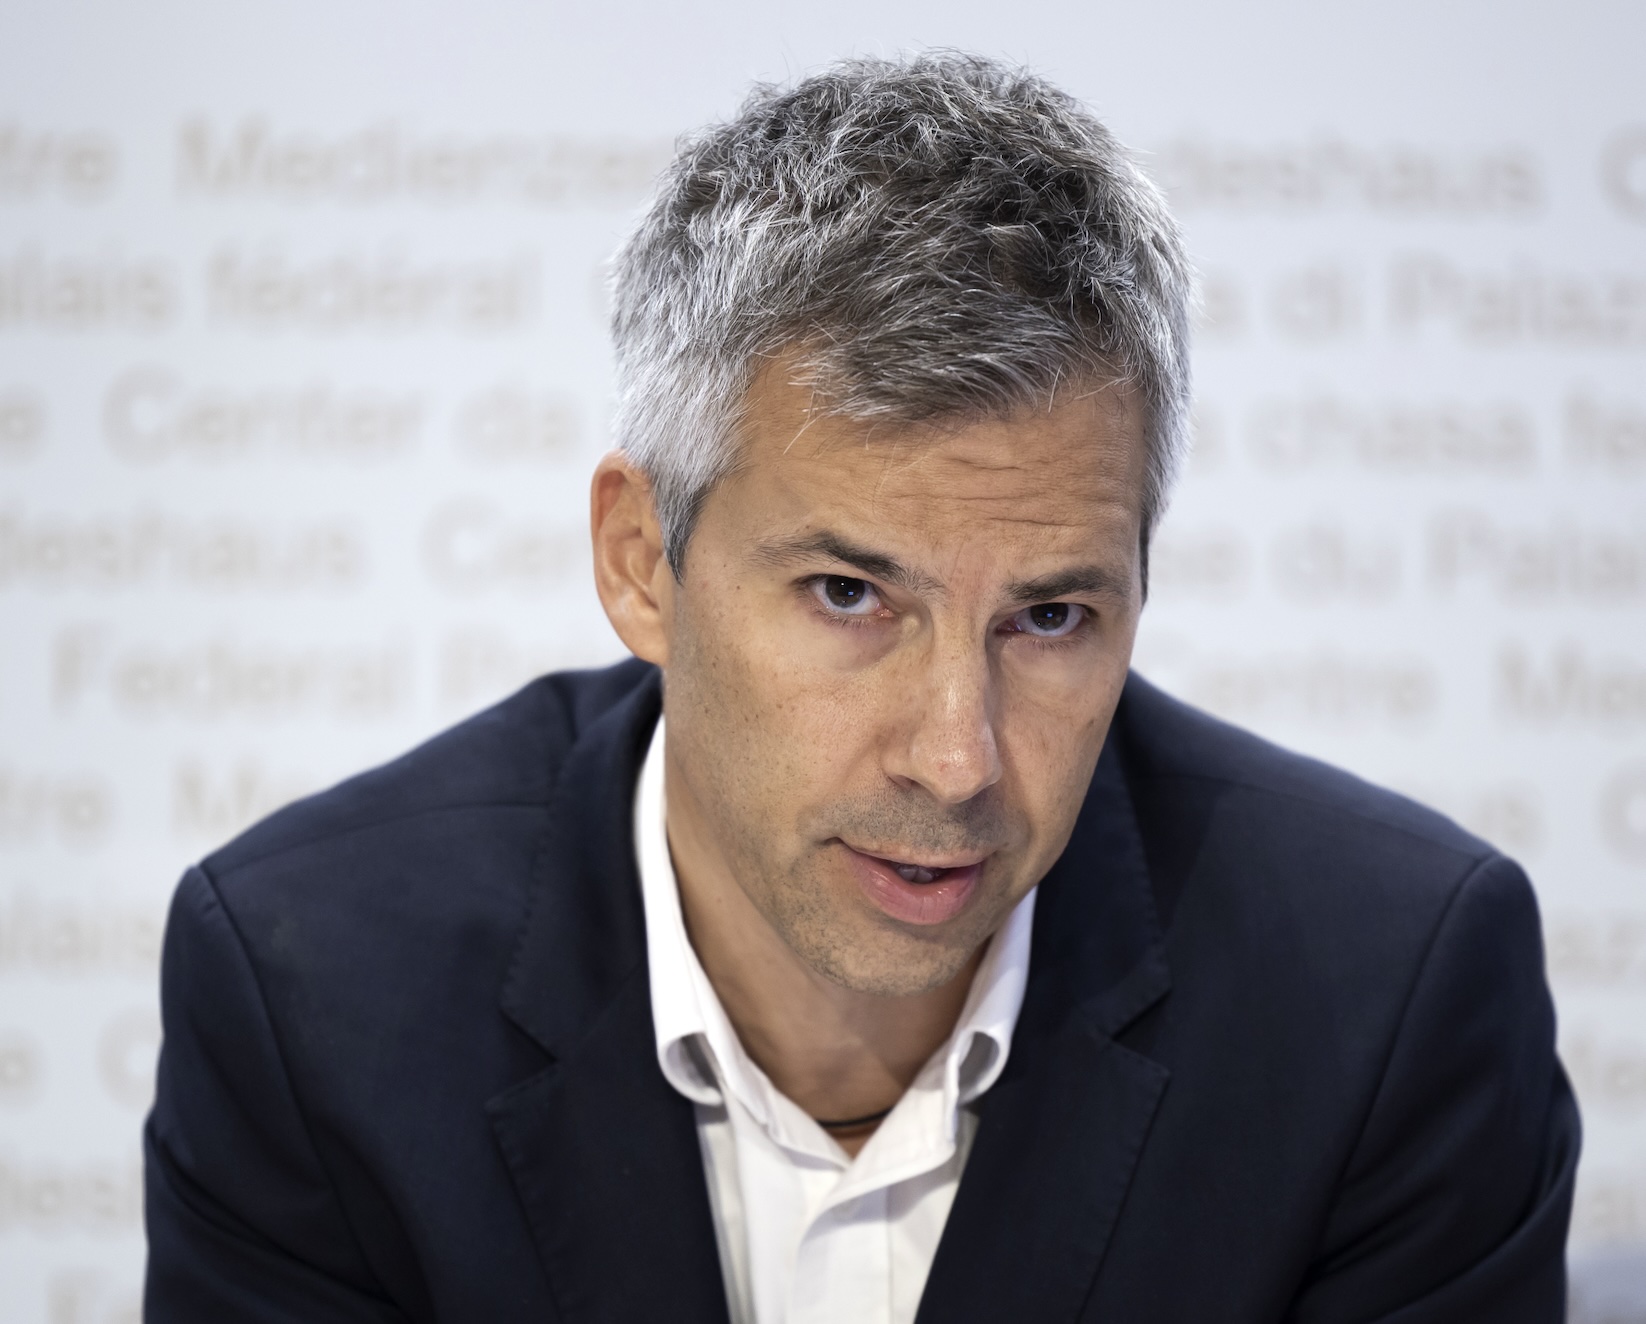
This is Marcel Salathé
This is Nicky Case
/https%3A%2F%2Fspecials-images.forbesimg.com%2Fimageserve%2F5a0320684bbe6f37dda1fa26%2F0x0.jpg%3Fbackground%3D000000%26cropX1%3D0%26cropX2%3D1836%26cropY1%3D241%26cropY2%3D2078)
We need to understand how pandemics spread and where the uncertainties lie.
For instance, what difference does varying the R make?
Pluck some input number out of the air: say number of infections is 250000 and infection-fatality rate is 1%
R ~Total deaths
>1 Half a million soon
1 Half a million eventually
0.9 22500
0.8 10000
0.7 5800
0.6 3750
0.5 2500
0.4 1670
0.3 1070
0.2 625
0.1 280
That, of course, is stupidly simple, but perhaps gives an inkling of what is meant when it is said the R needs to be below 1 and that 0.5 is much better than 0.9
Marcel Salathé & Nicky Case have produced an excellent tool to understand the thing properly.
Simple yet sophisticated. Simplicity, like minimalism, takes sophistication.
Please, please, devote the time necessary to go through it and then share it with everybody else. Understanding such things should be the duty of every citizen capable of understanding such things.
What Happens Next?COVID-19 Futures, Explained With Playable Simulations
This is Marcel Salathé
This is Nicky Case
posted by biffvernon at
12:02 pm
![]()

0 Comments:
Post a Comment
Subscribe to Post Comments [Atom]
<< Home